
Individual GWAS study methods and quality control
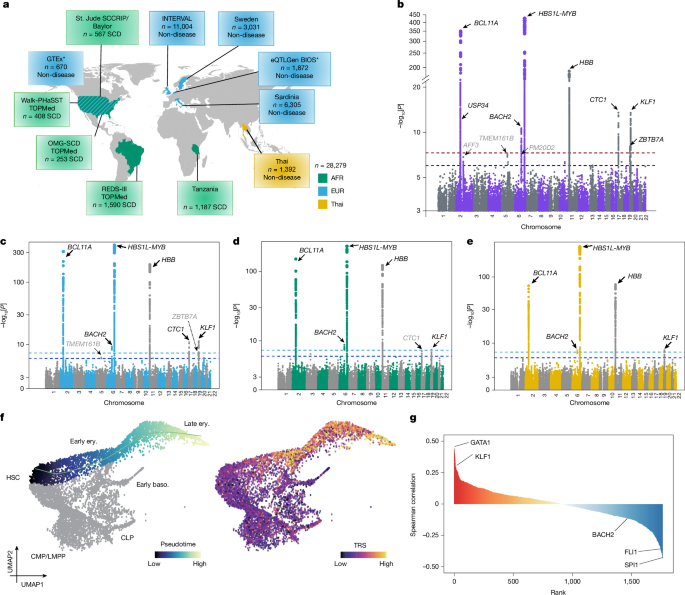
Details including study design, genotyping and imputation methods and quality control for the included studies are provided in Supplementary Table 1. The cohorts relied on different selection strategies, including unselected individuals from the population (Swedish, SardiNIA10, INTERVAL55, GTEx56, BIOS57), individuals with sickle cell disease (Tanzania45, Walk-PHaSST58, OMG-SCD59, REDS-III Brazil60, St. Jude Sickle Cell Clinical Research & Intervention Program (SCCRIP)/Baylor61,62) or individuals selected from a screened population (Thai). Note that, because our meta-analysis includes both general population (European ancestry) and high-HbF (African and Thai ancestry) cohorts, the effect sizes are not comparable across ancestries.
The Thai cohort has a unique study design: from a large general population of around 86,000 individuals, we intentionally screened for high HbF and sampled individuals with HbF levels higher than 2% of total haemoglobin. We then randomly selected other individuals from this same general population to serve as a contrast. Individuals with severe forms of thalassaemia were excluded. DNA extraction, sequencing and genotyping were performed after the sample selection. HbF levels for the entire cohort (enriched for individuals with high HbF) were inverse-normalization transformed before GWAS analysis.
We examined the relatedness among individuals in TOPMed (including Walk-PHaSST, OMG-SCD and REDS-III Brazil), Tanzania and Thai cohorts, and did not find outliers (KING relatedness above 0.0884) to be excluded. Data from the other cohorts do not include individual genotypes, but we have confirmed with the authors that the relatedness has been accounted for in their cohort-specific association studies. Most included samples had HbF measured in the traditional way using high-performance liquid chromatography; however two of the included cohorts (BIOS and GTEx) derived the HbF phenotype from expression data (in TPM units) as a ratio of gene expression of (HBG1 + HBG2)/HBB. We found this faithfully replicates expected results from the traditionally measured HbF cohorts (Supplementary Note). The included Swedish and Thai populations are previously undescribed cohorts and were analysed specifically for this study. All of the participants provided informed consent, and all of the studies obtained ethical approvals from local ethics review boards. Details about each cohort and their GWAS procedures are described in full in the Supplementary Note.
All GWAS summary statistics were lifted-over from their respective genome builds to reference genome hg38. Alleles were flipped according to the hg38 build reference allele and, if neither allele was present, the variant was removed. Strand ambiguous and non-biallelic SNPs were removed. Minor allele frequency was filtered to ≥0.1%. RSIDs were assigned using dbSNP v.144. All models included adjustment for age, sex and the top 10 principal components derived from the respective cohort. Moreover, for the SCD cohort analyses, SCD genotypes and hydroxyurea use were included as categorical covariates in the respective association models.
Meta-analysis
Fixed effects meta-analysis (FEMA) of all cohorts was performed using METAL r2020-05-05 (https://github.com/statgen/METAL)63 under the sample size-weighted scheme with genomic control, yielding results for 21,849,438 SNPs genome-wide.
For ancestry-specific meta-analysis, we deployed MAMA (v.16865), which has improved power in meta-analysis of different populations with low-false positive rates after correcting for cross-population LD and frequency differences24. We provided MAMA with reference panels consisting of 1000 genomes64 samples (892 AFR and 661 EUR) and Thai whole-genome sequenced samples (n = 198) to compute stratified LD scores (step 1). We then performed two sets of inverse-variance-weighted (IVW) FEMA without genomic control on all European or African cohorts. Step 2 of MAMA was subsequently performed on the summary statistics of the two FEMA and the Thai cohort, along with the LD score matrix from step 1, yielding 3,760,527 intersecting SNPs. Notably, the high correlation of effect estimates observed across populations (Extended Data Fig. 1e–g) is in part explicitly induced by MAMA’s underlying model of shared genetic effects. The remaining variability in effect estimates may reflect an interplay of biological and technical factors. These include inherent differences in allele frequencies and LD structures, as well as potential technical mismatches between non-European study cohorts and the reference resources used for imputation and LD estimation.
Identifying conditionally independent loci and multi-ancestry fine-mapping
Following the official guidance to use the largest available cohort as the LD reference in meta-analytic settings, we created an external LD reference panel from AllOfUs (v.5) data65 European samples (EUR, n = 51,125, downsampled to 10,000) for conditional analysis by GCTA-COJO (v.1.94.0)66, on the all-cohort FEMA summary statistics with options –cojo-slct –cojo-p 1e-06 –cojo-wind 10000 –cojo-collinear 0.9 –diff-freq 0.6 –maf 0.001. A separate run using an African reference panel (10,000 from AllofUs) was also performed. The conditionally independent loci identified by European-based COJO became our sentinel markers; loci with too much conditional z-score inflation (over tenfold) were discarded. We examined the 1 Mb windows centred on these sentinel markers and labelled them with the nearest or, if known, biologically relevant gene. Once each locus was determined, fine-mapping was performed using FINEMAP67 using the parameters: —non–funct —allow–missing —max–num–causal 1. Note that although the use of a European-only reference panel for COJO inevitably introduces LD mismatches for multi-ancestry summary statistics, we intended for it to only coarsely partition independent signals genome-wide, rather than to make precise conditional inference. Rather, downstream variant prioritization was jointly based on MAMA, MultiSuSiE, marginal association patterns and functional annotations.
Multi-ancestry fine-mapping was performed using MultiSuSiE30 on the 1 Mb regions centred on BACH2. Pre-computed LD matrices from the PanUKB consortium were leveraged for three ancestries: European (EUR), African (AFR) and East Asian (EAS, as a proxy for the Thai cohort). Cohort-specific summary statistics were lifted over to hg19 to match the LD matrices. Within AFR and EUR ancestry, cohorts were meta-analysed through the inverse variance-weighted scheme by METAL without genomic control to meet MultiSuSiE’s assumptions. Three- and two-ancestry (EUR and AFR) fine-mapping were then performed assuming component number L ∈ {3, 5, 10, 12, 15} with custom scripts.
Heritability and genetic correlation analyses
LD scores were established from AllofUs (v.5) LD panels as described above using maximum 1 cM window positions. LD score regression68 was performed on summary statistics restricted to high quality, HapMap 3 variants. LDAK69 was used to estimate heritability using the thin and BLD models appropriate for ancestry. Genetic correlations with blood cell traits were estimated using LDAK, using the thin model. Summary statistics for blood cell traits were obtained from the published BCX2 consortium summary statistics available online (https://www.mhi-humangenetics.org/en/resources/).
SCAVENGE
SCAVENGE27 was performed ( using custom scripts. We first obtained fine-mapped variants with posterior probabilities of causality from FINEMAP. We then collected scATAC–seq data from 10 individuals, comprising 33,819 cells across 23 annotated cell populations54. Slingshot70 was used to reconstruct the developmental progression of erythroid lineage and to assign pseudotime to each cell along the trajectory. Using the fine-mapped variants and single-cell chromatin accessibility data as the input, we calculated TRSs for individual cells. In parallel, we generated pseudobulk profiles based on cell type annotations to construct pseudobulk ATAC–seq datasets as previously described71, and used these data as input for peak calling with MACS272.
PCHi-C
For annotating genomic windows with genes, we used a published PCHi-C73 dataset spanning 15 haematopoietic cell types. We retained chromatin looping interactions with a CHiCAGO score > 5.
Human primary HSPC culture and in vitro erythroid differentiation
Human CD34+ HSPCs from mobilized peripheral blood of healthy adults were obtained from the Cooperative Center of Excellence in Hematology at the Fred Hutchinson Cancer Research Center. The primary HSPCs were thawed into a maintenance medium consisting of a StemSpan II base (StemCell Technologies), CC100 (StemCell Technologies), 50 ng ml−1 human TPO (Pepro Tech) and 1% penicillin–streptomycin (Life Technologies) and 1% of l-glutamine (Life Technologies)74,75.
After the maintenance phase, primary human HSPCs were differentiated using the three-phase culture system previously described76,77. First, a base erythroid medium was created by supplementing IMDM (Gibco) with 2% human AB plasma (SeraCare), 3% human AB serum (Life Technologies), 3 U ml−1 heparin, 10 μg ml−1 insulin, 200 μg ml−1 holo-transferrin and 1% penicillin–streptomycin. From day 1 to 7 in erythroid medium, this base medium was further supplemented with 3 U ml−1 EPO, 10 ng ml−1 human SCF and 1 ng ml−1 IL-3. From days 7–12, this base medium was further supplemented with 3 U ml−1 EPO and 10 ng ml−1 human SCF. After day 12, the base medium was supplemented with 1 mg ml−1 total of holo-transferrin and 3 U ml−1 of EPO.
Cell line culture
HEK293T cells were cultured in Dulbecco’s modified Eagle’s medium supplemented with 10% FBS and 1% penicillin–streptomycin. K562 cells were cultured in Iscove’s modified Dulbecco’s medium supplemented with 10% FBS and 1% penicillin–streptomycin.
Genome editing of human primary HSPCs
Genome editing was performed in human primary CD34+ HSPCs using the 4D-Nucleofector system (Lonza) with the P3 Primary Cell 4D-Nucleofector X Kit S (Lonza). For CRISPR–Cas9-mediated enhancer deletion, ribonucleoprotein (RNP) complexes were assembled by combining 100 pmol Cas9 protein (IDT) with 100 pmol chemically modified sgRNAs (Synthego) and incubating at room temperature for 15 min. RNPs were delivered into CD34+ HSPCs with the P3 nucleofection reagent supplemented with nucleofection enhancer (IDT) at a 20:1 ratio, using program DZ-100 on the 4D-Nucleofector system. To generate the high-HbF–associated variant rs1010474, 20 μg of ABE (ABE8e)78 protein was incubated with 100 pmol chemically modified sgRNA (Synthego) at room temperature for 20 min. The assembled ABE-RNP complexes were delivered into CD34+ HSPCs using P3 reagent and program DZ-100. For editing NRF2/BACH2 motifs within the HBG1/2 promoters, 2 μg of in vitro transcribed ABE8e or TadCBEb79 were mixed with 100 pmol chemically modified sgRNAs (Synthego) and nucleofected into CD34+ HSPCs using program DS-130. Electroporated cells were collected 3 days after nucleofection for genomic DNA and RNA extraction using the AllPrep DNA/RNA Micro Kit (Qiagen) according to the manufacturer’s instructions. A list of all guide RNA sequences used for genome editing is provided in Supplementary Table 11.
BACH2 shRNA knockdown and overexpression cloning and lentivirus packing
To knock down BACH2, DNA sequences for shRNAs were designed using the GPP Web Portal online tool ( DNA oligos of shRNA sequences for targeted RNAs or scramble shRNAs were individually cloned into the pLKO.1-GFP vector. For overexpression, the human BACH2 coding sequence was synthesized by Azenta and inserted into the HMD lentiviral vector. All of the plasmids were validated by whole-plasmid sequencing by Plasmidsaurus. Lentiviral particles were produced as previously described. In brief, 5 × 10⁶ HEK293T cells in a 10 cm dish were co-transfected with 10 μg pLKO.1 shRNA constructs or overexpression construct, 7.5 μg of psPAX2 and 3 μg pMD2.G plasmids. The supernatant containing viral particles was collected twice at 48 h and 72 h after transfection, then filtered through Millex-GP Filter Unit (0.45 μm pore size, Millipore) and concentrated by ultracentrifugation (24,000 rpm, 2 h, 4 °C). Concentrated virus was used to transduce HSPCs in the presence of 8 μg ml−1 polybrene (Millipore) by spinfection (2,000 rpm, 1.5 h, room temperature). Transduced cells were sorted based on GFP expression by fluorescence-activated cell sorting (FACS) and subjected to erythroid differentiation and functional analyses.
RNA isolation and qPCR with reverse transcription
RNA was collected from cultured cells using the Total RNA Purification Micro Kit (Norgen Biotek) with DNase I treatment according to the manufacturer’s protocol. The cDNA synthesis was carried out using PrimeScript RT Master Mix (TaKaRa) according to the manufacturer’s protocol. qPCR was run on the CFX96 or CFX384 Real Time System (BioRad) using iQ SYBR Green Supermix (BioRad) according to the kit instructions. The relative expression of different sets of genes was quantified to ACTB mRNA, with control samples serving as the reference. Primer pairs for RT–qPCR are listed by gene in Supplementary Table 11.
Cell staining for glow cytometry analysis
To assess erythroid differentiation, transduced or genome-edited HSPCs were collected at the indicated timepoints. After a DPBS wash, cells were stained on ice for 30 min in FACS buffer (DPBS + 0.1% BSA) with anti-CD71_BV421 (BioLegend) and anti-CD235a_APC-Cy7 (BioLegend). Cells were then washed and resuspended in FACS buffer for flow cytometry analysis. For BACH2 intracellular staining, 3 × 10⁵ human primary HSPCs were collected and washed with DPBS, then fixed in 4% paraformaldehyde (PFA) in PBS for 15 min. Cells were permeabilized with 0.2% Tween-20 in PBS for 10 min and stained with BACH2-PE (BioLegend) in 0.2% Tween-20 in PBS for 1 h at room temperature. Cells were subsequently washed and resuspended in FACS buffer for flow cytometry analysis. To quantify the F cell frequency in transduced or genome-edited HSPCs undergoing erythroid differentiation, cells were fixed in 4% PFA in PBS for 15 min, permeabilized with 0.2% Tween-20 in PBS for 10 min and stained with anti-HbF-PE (BD Biosciences) or anti-HbF-APC (Invitrogen) in PBS containing 0.1% BSA for 1 h at room temperature. Cells were subsequently washed and resuspended in FACS buffer for flow cytometry analysis. For each sample, 30,000–50,000 events were acquired on the BD LSRFortessa (BD Biosciences) system, and analysed using FlowJo software (v.10.8.1, BD Biosciences).
Lentiviral reporter assays
To investigate the functional impact of BACH2 regulatory variants, lentiviral reporter constructs were generated by cloning the BACH2 regulatory element containing either the non-risk allele or the risk alleles upstream of a minimal TATA-box promoter (miniP) driving eGFP expression as a functional readout. Lentiviral particles were produced by transient transfection in HEK293T cells and concentrated by ultracentrifugation. To ensure experimental consistency, normalization was performed at the genomic level by quantifying the number of integrated proviruses. Specifically, genomic DNA (gDNA) was extracted from transduced K562 cells and the proviral copy number was determined by qPCR using the Lenti-X Provirus Quantitation Kit (Takara) using a standard curve of CT values versus copy number for precise titration. Subsequently, titre-normalized lentiviruses were used to transduce primary HSPCs which then underwent in vitro erythroid differentiation. The regulatory activity of the tested elements was quantitatively assessed by measuring GFP expression using flow cytometry throughout the differentiation.
Co-immunoprecipitation and western blotting
HEK293T or K562 cells (2 × 10⁷) expressing Flag–NRF2, HA–BACH2 or their truncation constructs were collected and lysed in 1 ml lysis buffer (50 mM Tris pH 7.4, 150 mM NaCl, 0.05% Igepal, 0.5% NP-40, 0.5 mM PMSF and protease inhibitor cocktail), followed by two 10-s pulses of sonication. The lysates were pre-cleared with 15 μl protein G beads (Invitrogen) for 30 min at 4 °C. Pre-cleared lysates were incubated with 5 μg anti-Flag M2 antibody (Sigma-Aldrich) or 5 μg isotype IgG control (Santa Cruz) for 3–4 h at 4 °C, and then incubated with protein G beads for an additional 1 h. The beads were washed four times with wash buffer (50 mM Tris pH 7.4, 300 mM NaCl, 0.5% NP-40, 0.5 mM PMSF and protease inhibitor cocktail). Protein complexes were eluted by boiling in 50 μl 1× Laemmli sample buffer (Bio-Rad) at 100 °C for 10 min and chilled on ice for 5 min. DNase-I-treated immunoprecipitation was performed under the same conditions, with 25 U ml−1 DNase I added during antibody incubation. For western blotting, denatured samples were resolved on 4–15% Mini-PROTEAN TGX precast gels (Bio-Rad) and transferred to PVDF membranes using the Trans-Blot Turbo system (Bio-Rad). Membranes were blocked in 3% BSA in PBST (PBS containing 0.1% Tween-20) for 30 min at room temperature and then incubated overnight at 4 °C with primary antibodies: anti-Flag (CST, 14793, 1:2,000), anti-HA (CST, 2367T, 1:2,000), anti-BACH2 (Proteintech, 27635-1-AP, 1:2,000) and anti-MAFK/F/G (Santa Cruz, sc-166548, 1:1,000). After three washes with PBST, membranes were incubated with HRP-conjugated anti-mouse or anti-rabbit secondary antibodies (1:5,000) and developed using ECL substrate (Bio-Rad). Signals were visualized using a ChemiDoc imaging system (Bio-Rad).
Silver staining and in vitro native-PAGE assays
Recombinant human BACH2 (MYC/DDK-tagged, 92.4 kDa) and NRF2 (N-His-tagged, 67.6 kDa) were purchased from OriGene; MafK (N-His-tagged, 19.7 kDa) was purchased from ProSpec. Protein purity was assessed by SDS–PAGE followed by silver staining using the Pierce Silver Stain for Mass Spectrometry Kit (Thermo Fisher Scientific) before use in subsequent biochemical assays.
For in vitro analysis of the NRF2–BACH2 complex, recombinant BACH2, NRF2 and MafK proteins were mixed under the indicated conditions in binding buffer (10 mM HEPES, pH 7.5; 20 mM KCl; 1 mM MgCl2; 1 mM DTT) and incubated at room temperature for 25 min. The samples were then combined with 6× native sample buffer (600 mM Tris-HCl, 50% glycerol, 0.02% bromophenol blue) and directly loaded onto 4–20% Mini-PROTEAN TGX precast gels (Bio-Rad) and run in Tris/Glycine electrophoresis buffer (Bio-Rad) at 4 °C. Gels were subjected to standard western blotting procedures and were analysed by immunoblotting with anti-BACH2 (Proteintech, 27635-1-AP) and anti NRF2 (CST, 12721T) antibodies at 1:2,000 dilution.
Protein pull-down assay
Recombinant His-tagged NRF2 (5 pmol) or His-tagged MafK (5 pmol) was immobilized on 20 μl HisPur Ni-NTA Resin (Thermo Fisher Scientific) in binding buffer (50 mM Tris-HCl, pH 7.4, 150 mM NaCl, 20 mM imidazole, 0.05% NP-40 and 0.5 mM PMSF) for 1 h at 4 °C with rotation. After two washes with binding buffer, purified recombinant BACH2–MYC/DDK (10 pmol) was added and incubated for 2 h at 4 °C. A control reaction containing BACH2–MYC/DDK incubated with Ni-NTA Resin was performed in parallel to assess non-specific binding of BACH2 to the Ni-NTA resin. Beads were washed three times with a wash buffer (50 mM Tris-HCl, pH 7.4, 300 mM NaCl, 20 mM imidazole, 0.05% NP-40 and 0.5 mM PMSF) of the same composition, and the bound proteins were eluted by boiling in a 1× SDS sample buffer. Eluted proteins were analysed by immunoblotting with anti-BACH2 (Proteintech, 27635-1-AP) and anti-His (Proteintech, 10001-0-AP) antibodies at 1:2,000 dilution.
ChIP
ChIP was performed using chromatin prepared from 5 × 10⁶ differentiated erythroid progenitor cells derived from primary human CD34+ cells. On day 8 of erythroid differentiation, cells were cross-linked with 1% formaldehyde (Pierce Life Technologies, 28906) and quenched with glycine. Chromatin was processed using the truChIP Chromatin Shearing Kit (Covaris, 520127) according to the manufacturer’s protocol. Lysates were sonicated with an E220 sonicator (Covaris, 500239) to generate DNA fragments of 300–500 bp. Sheared chromatin was precleared with 15 μl Dynabeads Protein G (Invitrogen) supplemented with 100 μg BSA and 100 μg ssDNA. Precleared lysates were incubated overnight at 4 °C with 5 μg anti-NRF2 antibody (Abcam, ab62352) or normal rabbit IgG control (CST, 2729S). Beads were sequentially washed with 600 μl lysis buffer, 600 μl high-salt wash buffer (1% Triton X-100, 0.1% sodium deoxycholate, 50 mM Tris-HCl pH 8.0, 0.5 M NaCl, 5 mM EDTA), 600 μl LiCl immune complex wash buffer (0.25 M LiCl, 0.5% Igepal, 0.5% sodium deoxycholate, 10 mM Tris-HCl pH 8.0, 1 mM EDTA), followed by two washes with 600 μl TE buffer (10 mM Tris-HCl pH 8.0, 1 mM EDTA) at 4 °C. The complexes were eluted in 200 μl freshly prepared elution buffer (1% SDS, 0.1 M NaHCO3) with rotation at room temperature for 15 min. Reverse cross-linking was performed by adding 8 μl 5 M NaCl and incubating at 65 °C for 4 h, followed by the addition of 4 μl 0.5 M EDTA and 10 μl proteinase K (10 mg ml−1) and incubation at 55 °C for 2 h. DNA was purified by phenol–chloroform extraction and ethanol precipitation with 20 μg yeast tRNA as a carrier. The DNA pellets were dissolved in 50 μl double-distilled H2O for RT–qPCR analysis. Primer sequences are provided in Supplementary Table 11.
EMSA
Oligonucleotides used as IRDye-700-labelled probes are listed in Supplementary Table 11. The sense strand of each probe was synthesized with a 5′ IRDye 700 label (IDT) and annealed to the corresponding unlabelled antisense strand by heating at 100 °C for 5 min followed by slow cooling to room temperature. Unlabelled probes used for cold competition assays were prepared in the same manner. Nuclear extracts from K562 cells overexpressing either Flag–NRF2 or Flag–BACH2 were isolated using the NE-PER Nuclear and Cytoplasmic Extraction Kit (Thermo Fisher Scientific) according to the manufacturer’s instructions. For binding reactions with wild-type probes, varying amounts of nuclear extract (0.5–6 µg) were incubated with 5 nM IRDye-700-labelled DNA probes in binding buffer (10 mM Tris-HCl, pH 7.5; 50 mM KCl; 10 mM MgCl2; 3.5 mM DTT; 0.25% Tween-20; 50 ng µl−1 poly dI:dC) for 25 min at room temperature. For cold competition assays, 1 µM annealed unlabelled probe was added after the labelled probe and incubated for an additional 10 min. To compare the binding affinity between NRF2 or BACH2 and edited probe variants, 4 µg of nuclear extract was incubated with 5 nM IRDye-700 labelled DNA probes in a binding buffer for 20 min at room temperature. After incubation, samples were mixed with 10× Orange Loading Dye (LI-COR Biosciences) and resolved on Novex TBE Gels 4-20% (Invitrogen) in 0.5× TBE buffer at 150 V for 50 min. Gels were briefly rinsed in double-distilled H2O and immediately imaged using an Odyssey CLx imager. Quantification of image was performed using the Image Studio software (LI-COR Biotech, v.6.1.0.79).
Immunofluorescence and RNA in situ hybridization
Immunofluorescence was performed as described previously with minor modifications. In brief, 3 × 10⁵ cells were collected, washed once with DPBS and resuspended in 0.1% BSA in DPBS. Cells were cytospun onto poly-d-lysine-coated German coverslips (Neuvitro Corporation) at 300 rpm for 4 min and fixed with 4% PFA (Electron Microscopy Sciences, 15714) for 15 min at room temperature. Fixed cells were permeabilized with 0.5% Triton X-100 for 5 min on ice and blocked with 1% BSA in PBS for 30 min at room temperature. Cells were then incubated overnight at 4 °C with mouse anti-NRF2 (Santa Cruz, sc-365949, 1:50) and rabbit anti-BACH2 (CST, 80775, 1:50) antibodies. After primary incubation, AF647-conjugated goat anti-mouse IgG and AF594-conjugated goat anti-rabbit IgG secondary antibodies (1:1,000) were applied for 1 h at room temperature in the dark. Nuclei were counterstained with DAPI for 1 min at room temperature. Coverslips were mounted on glass slides and sealed. Images were acquired using a Leica TCS SP8 confocal microscope.
For co-staining of the primary transcripts of HBG1/2 (pre-HBG1/2) and NRF2, RNA FISH was performed first, followed by immunofluorescence. In brief, cells were fixed with 4% PFA for 15 min, permeabilized in 0.5% Triton X-100 containing 2 mM ribonucleoside vanadyl complex (NEB), and dehydrated in 75% ethanol overnight. Cells were then incubated with 300 ng denatured Dig-labelled FISH probes in hybridization buffer (50% formamide in 2× SSC) at 50 °C overnight. After hybridization, cells were washed twice with Sal I buffer (50% formamide, 0.1× SSC, 0.1% SDS) and incubated with sheep anti-digoxigenin (Roche, 11333089001, 1:400) for 1 h at room temperature. After two washes with Sal II buffer (2× SSC containing 8% formamide), cells were incubated with mouse anti-NRF2 (Santa Cruz, sc-365949, 1:50) overnight at 4 °C. After two additional washes with Sal II buffer, cells were incubated with Cy3-conjugated donkey anti-sheep IgG (1:1,000) and AF647-conjugated goat anti-mouse IgG secondary antibodies (1:1000) for 1 h at room temperature in the dark. Nuclei were counterstained with DAPI. Coverslips were mounted on glass slides and sealed. Images were acquired using a Leica TCS SP8 confocal microscope.
DIG-labelled pre-HBG1/2 RNA probes were synthesized using the DIG RNA Labelling Mix (Roche, 11277073910) and T7 RNA Polymerase (Promega) according to the manufacturer’s instructions. DNA templates containing a T7 promoter were generated by PCR using HBG1/2 intron 2 primers (Supplementary Table 11). In vitro transcription was performed at 37 °C for 2 h using T7 RNA polymerase in the presence of the DIG RNA Labelling Mix, followed by DNase I treatment to remove the DNA template. RNA probes were purified using Monarch RNA Cleanup Columns (NEB) and analysed by RNA gel electrophoresis to assess probe integrity and fragment size.
Measurement of NRF2 and pre-HBG1/2 transcription focus size
For quantifying NRF2 or pre-HBG1/2 transcription foci in K562 cells, HSPCs and differentiated erythroid cells, cells were subjected to IF or IF-FISH as described above. Images were acquired on a Leica TCS SP8 confocal microscope with z-stack acquisition. Raw images were imported into Fiji/ImageJ for analysis. Each channel was separated, and a maximum-intensity z-projection was generated. When necessary, background subtraction and linear contrast adjustment were applied uniformly across samples. NRF2 and pre-HBG1/2 signals were then segmented using an optimal threshold. Regions of interest (ROIs) were defined based on the DAPI signal. Individual cells were analysed using the Analyze Particles tool in Fiji/ImageJ (default settings: size 0-infinity, circularity 0.00-1.00). A total of 10–30 cells were quantified per condition, and the results were plotted in Prism 10.
Colocalization analysis of NRF2 and pre-HBG1/2
Colocalization between NRF2 and pre-HBG1/2 was quantified using Manders’ overlap coefficients (M1 and M2) implemented in the JaCoP plugin in Fiji/ImageJ. Images were acquired on a Leica TCS SP8 confocal microscope with z-stack acquisition. Raw images were imported into Fiji/ImageJ, channels were separated and a maximum-intensity z-projection was generated for analysis. When necessary, background subtraction and linear contrast adjustment were applied uniformly across samples. Individual cells were segmented based on DAPI. Manders’ coefficients M1 and M2 were calculated following the optimal threshold to determine the fraction of signal from channel A overlapping with channel B and vice versa. A total of 10–30 cells was quantified per condition, and the results were plotted in Prism 10.
RNA-seq data processing
Total RNA samples were processed and sequenced using Genewiz RNA-seq service. All RNA-seq data were aligned to the human reference genome hg38 using STAR80 with the parameters –runMode alignReads –chimSegmentMin 20. The resulting alignments were sorted, and unmapped reads were removed using SAMtools (v.1.21) with option -F 516. Gene-level read counts were then generated by featureCounts81 using the human reference gene annotation. Differentially expressed genes were identified with DESeq282 using the Wald test, applying thresholds of P < 0.05 and fold change > 1.4 (Supplementary Table 10)
CUT&RUN and library preparation and sequencing
CUT&RUN experiments were performed using the CUTANA ChIC/CUT&RUN Kit, with slight modifications as described previously83. In brief, around 500,000 cells were washed in a buffer containing digitonin (0.01% digitonin) and bound to 10 μl of activated concanavalin A beads. Bead-bound cells were incubated overnight at 4 °C with 0.5 μg NRF2 primary antibody (Sigma-Aldrich, SAB5700720), 0.5 μg NFE2 primary antibody (Sigma-Aldrich, HPA001914) or 0.5 μg BACH2 antibody cocktail. The BACH2 antibody cocktail comprised three rabbit polyclonal anti-BACH2 antibodies targeting distinct epitopes (Sigma-Aldrich, HPA058384, amino acids 263–349; Sigma-Aldrich, HPA051384, amino acids 169–263; Abcam, ab226394, amino acids 750–841), premixed at equal concentrations. After washing, cells were incubated with pA/G-MNase for 1 h at 4 C and targeted chromatin digestion initiated by the addition of 100 mM CaCl2 and allowed to proceed for 30 min at 0 °C, at which time stop buffer containing E. coli spike-in DNA was added. The reaction was incubated at 37 °C for 30 min, to release chromatin fragments and then purified by phenol–chloroform extraction followed by ethanol precipitation.
CUT&RUN DNA library preparation was carried out using The NEBNext Ultra II DNA Library Prep Kit as described previously21. In brief, 15 ng of CUT&RUN DNA were treated with endprep module at 20 °C for 30 min and 50 °C for 1 h to reduce the melting of short DNA. Ligation was performed by adding 1 pmol of NEB adapter and ligation mix and incubated at 20 °C for 15 min. To clean up the reaction, 1.75× volumes of SPRIselect beads (Beckman Coulter) was added to capture short ligation products. PCR amplification was performed for 12 cycles. The resulting libraries were purified with 1.2× volume of SPRIselect beads then analysed and quantified by Qubit and Tapestation. Libraries with different indexes were pooled, and Illumina paired-end sequencing was performed using the NextSeq platform with NextSeq-1000 P2 Kit (75 cycles) (2 × 50 bp, 6-bp index).
CUT&RUN data processing and peak calling
All CUT&RUN sequencing data in this study were processed using CUT&RUNTool (https://bitbucket.org/qzhudfci/cutruntools/src/default/)84, which performs sequential steps of read trimming, alignment, peak calling and motif analysis. First, paired-end sequencing reads were trimmed with Trimmomatic (v.0.36)85 to remove adapter sequences from the 3′ end using the following parameters: ILLUMINACLIP:2:15:4:4: true LEADING:20 TRAILING:20 SLIDINGWINDOW:4:15. To further eliminate residual adapter sequences (up to 6 bp) not removed by Trimmomatic, an additional trimming step was performed using Kseq ( The cleaned reads were then aligned to the human reference genome hg38 by Bowtie2 (v.2.5)86 with parameters –dovetail and –phred33. The resulting BAM files were sorted, indexed and duplicate reads were marked using Picard (v.3.4.0) MarkDuplicates. Finally, unmapped, unmated and duplicate reads were removed with SAMtools (v.1.21)87, generating high-quality alignments for downstream analyses. MACS72 v.2.2 was used to call peaks from the BAM file with narrowPeak setting, with q-value cut-off of 0.01.
CUT&RUN normalizing to E. coli spike-in DNA
To ensure comparability across CUT&RUN data, we normalized the data using E. coli spike-in DNA. In addition to aligning reads to the human reference genome hg38, sequencing reads were separately aligned to the E. coli K12 MG1655 reference, and non-uniquely mapped reads were removed. For each CUT&RUN dataset, the number of uniquely aligned E. coli reads was quantified and normalized to the total number of uniquely aligned human hg38 reads. A normalization factor was then calculated so that the E. coli spike-in signal was equalized across all CUT&RUN data. This single scalar normalization ratio was applied using the –scaleFactor option in the deepTools (v.3.5.5)88 bamCoverage function to generate normalized bigWig files for visualization and comparative analyses.
In silico base-perturbation analysis of TF binding
To evaluate the contribution of individual nucleotides to the binding affinity of BACH2, NRF2 and NFE2, we generated a total of five variant sequences, each containing a single in silico base substitution relative to the reference sequence GTTTGCCTTGTCAAGGCTAT. These sequences were analysed using FIMO89 for motif scanning with a significance threshold of P < 0.05. For each sequence, we extracted the log-likelihood ratio score reported by FIMO for potential motif matches at each position. Comparison of these scores enabled us to estimate the effect of single-base perturbations on motif binding affinity.
Statistics and reproducibility
Statistical analyses were performed with GraphPad Prism 10, R (v.4.3) and Python (v.3.8 and 3.12). The sample sizes, statistical methods and significance for all graphs are described in the figure legends.
For statistical genetic analyses, GWAS on the eQTLgen BIOS cohorts and the TOPMed cohort were performed in SAIGE v.0.44.6.4, which implements single-variant tests using two-sided score tests derived from generalized linear mixed models built using sparse genetic relationship matrices; saddlepoint approximation is applied with a cut-off of 2. GWAS on the Tanzanian cohort was performed in Regenie v.2.2.4, and the Thai cohort in Regenie v.3.1.2—both implement a ridge regression using subsets of high-quality genome-wide variants (step 1) before fitting a linear regression with step 1 predictions as offsets and deriving P values from two-sided Wald tests. FEMA of all cohorts was performed using METAL v.2020-05-05 under the sample size scheme, computing P values from two-sided z-tests. MAMA (commit 1686586) incorporates single-ancestry inputs from IVW FEMA (performed by METAL) and computes two-sided Wald test P values from the effect estimates and standard errors derived from its multi-ancestry shrinkage estimator. In statistical fine-mapping, GCTA-COJO (v.1.94.0) performs stepwise multiple regressions based on summary statistics and LD reference panels and reports two-sided t-tests for regression coefficients. FINEMAP (v.1.4.1) and MultiSuSiE (v.1.0) are both Bayesian frameworks that estimates posterior inclusion probabilities and credible sets; they do not perform frequentist statistical tests: FINEMAP performs Bayesian variable selection using shotgun stochastic search and Bayes factors, and MultiSuSiE performs Bayesian regression under the sum-of-single-effects (SuSiE) model after accounting for shared and ancestry-specific effects.
For functional experiments, unpaired two-tailed t-tests were used to analyse between-group differences. P < 0.05 was considered to indicate statistical significance. No data were excluded from the analysis. Microscopy imaging, western blotting and EMSA were repeated independently at least three times with similar results.
Reporting summary
Further information on research design is available in the Nature Portfolio Reporting Summary linked to this article.










Leave a Reply